Graphics
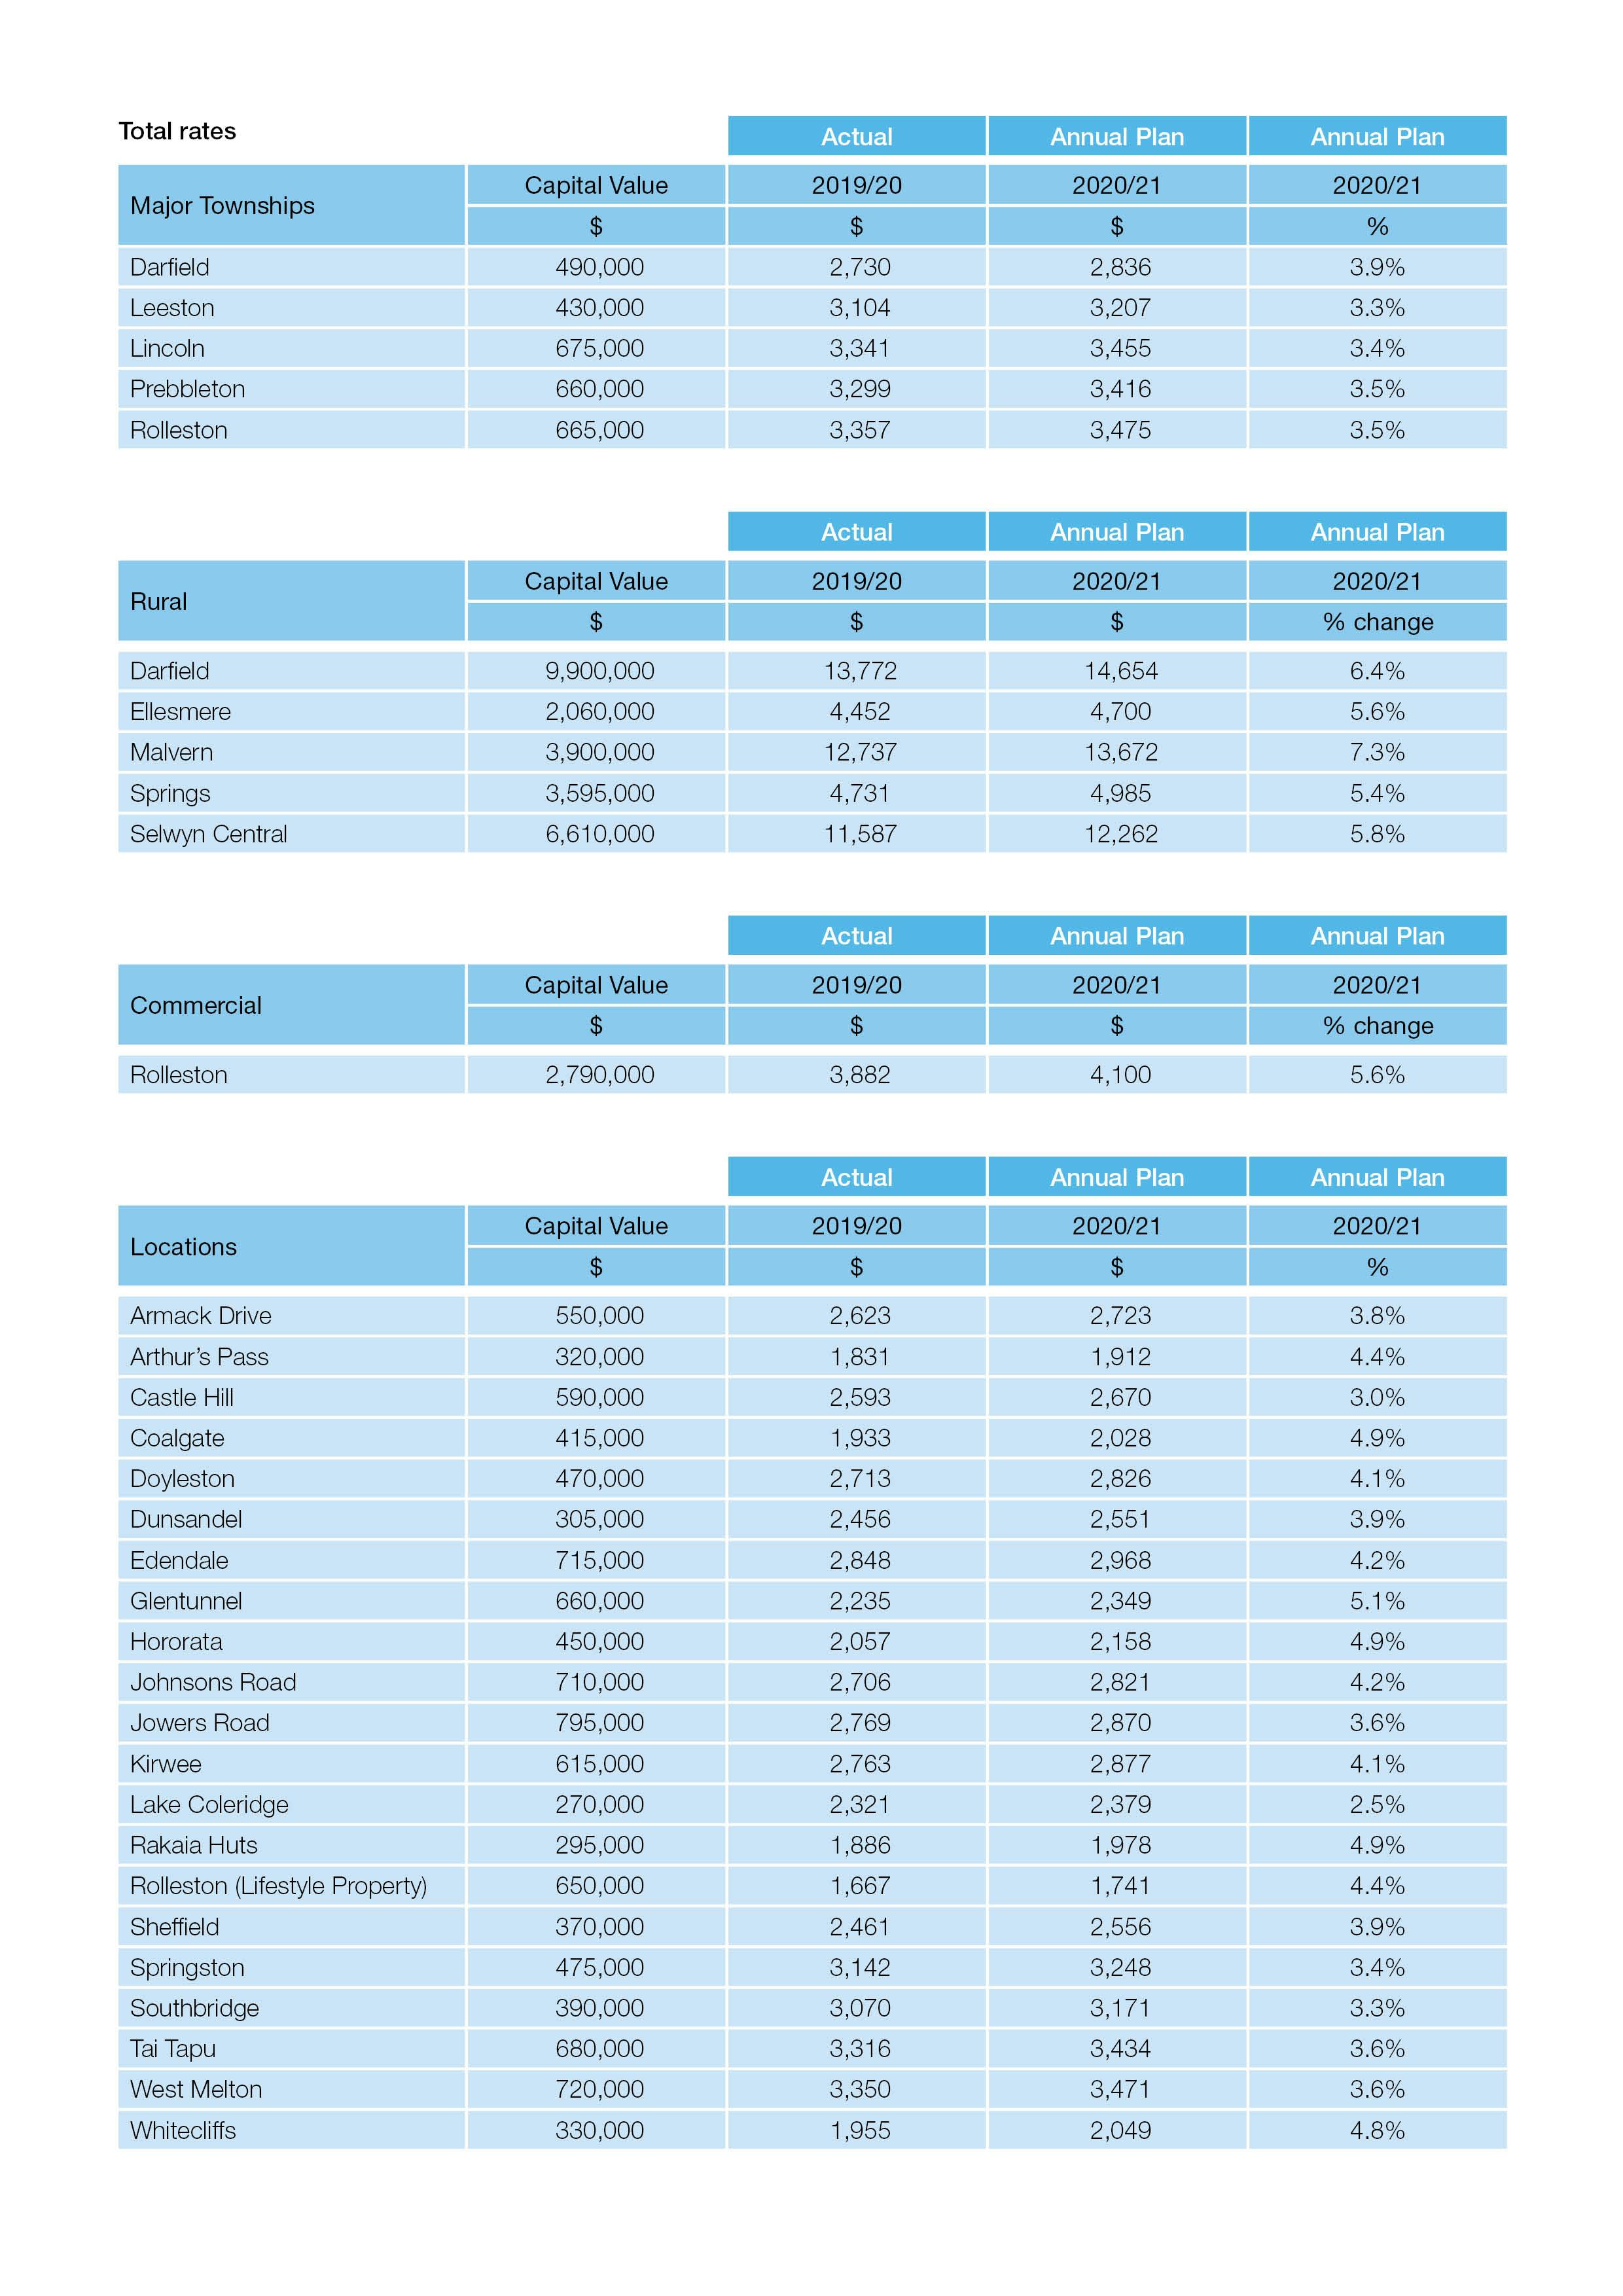
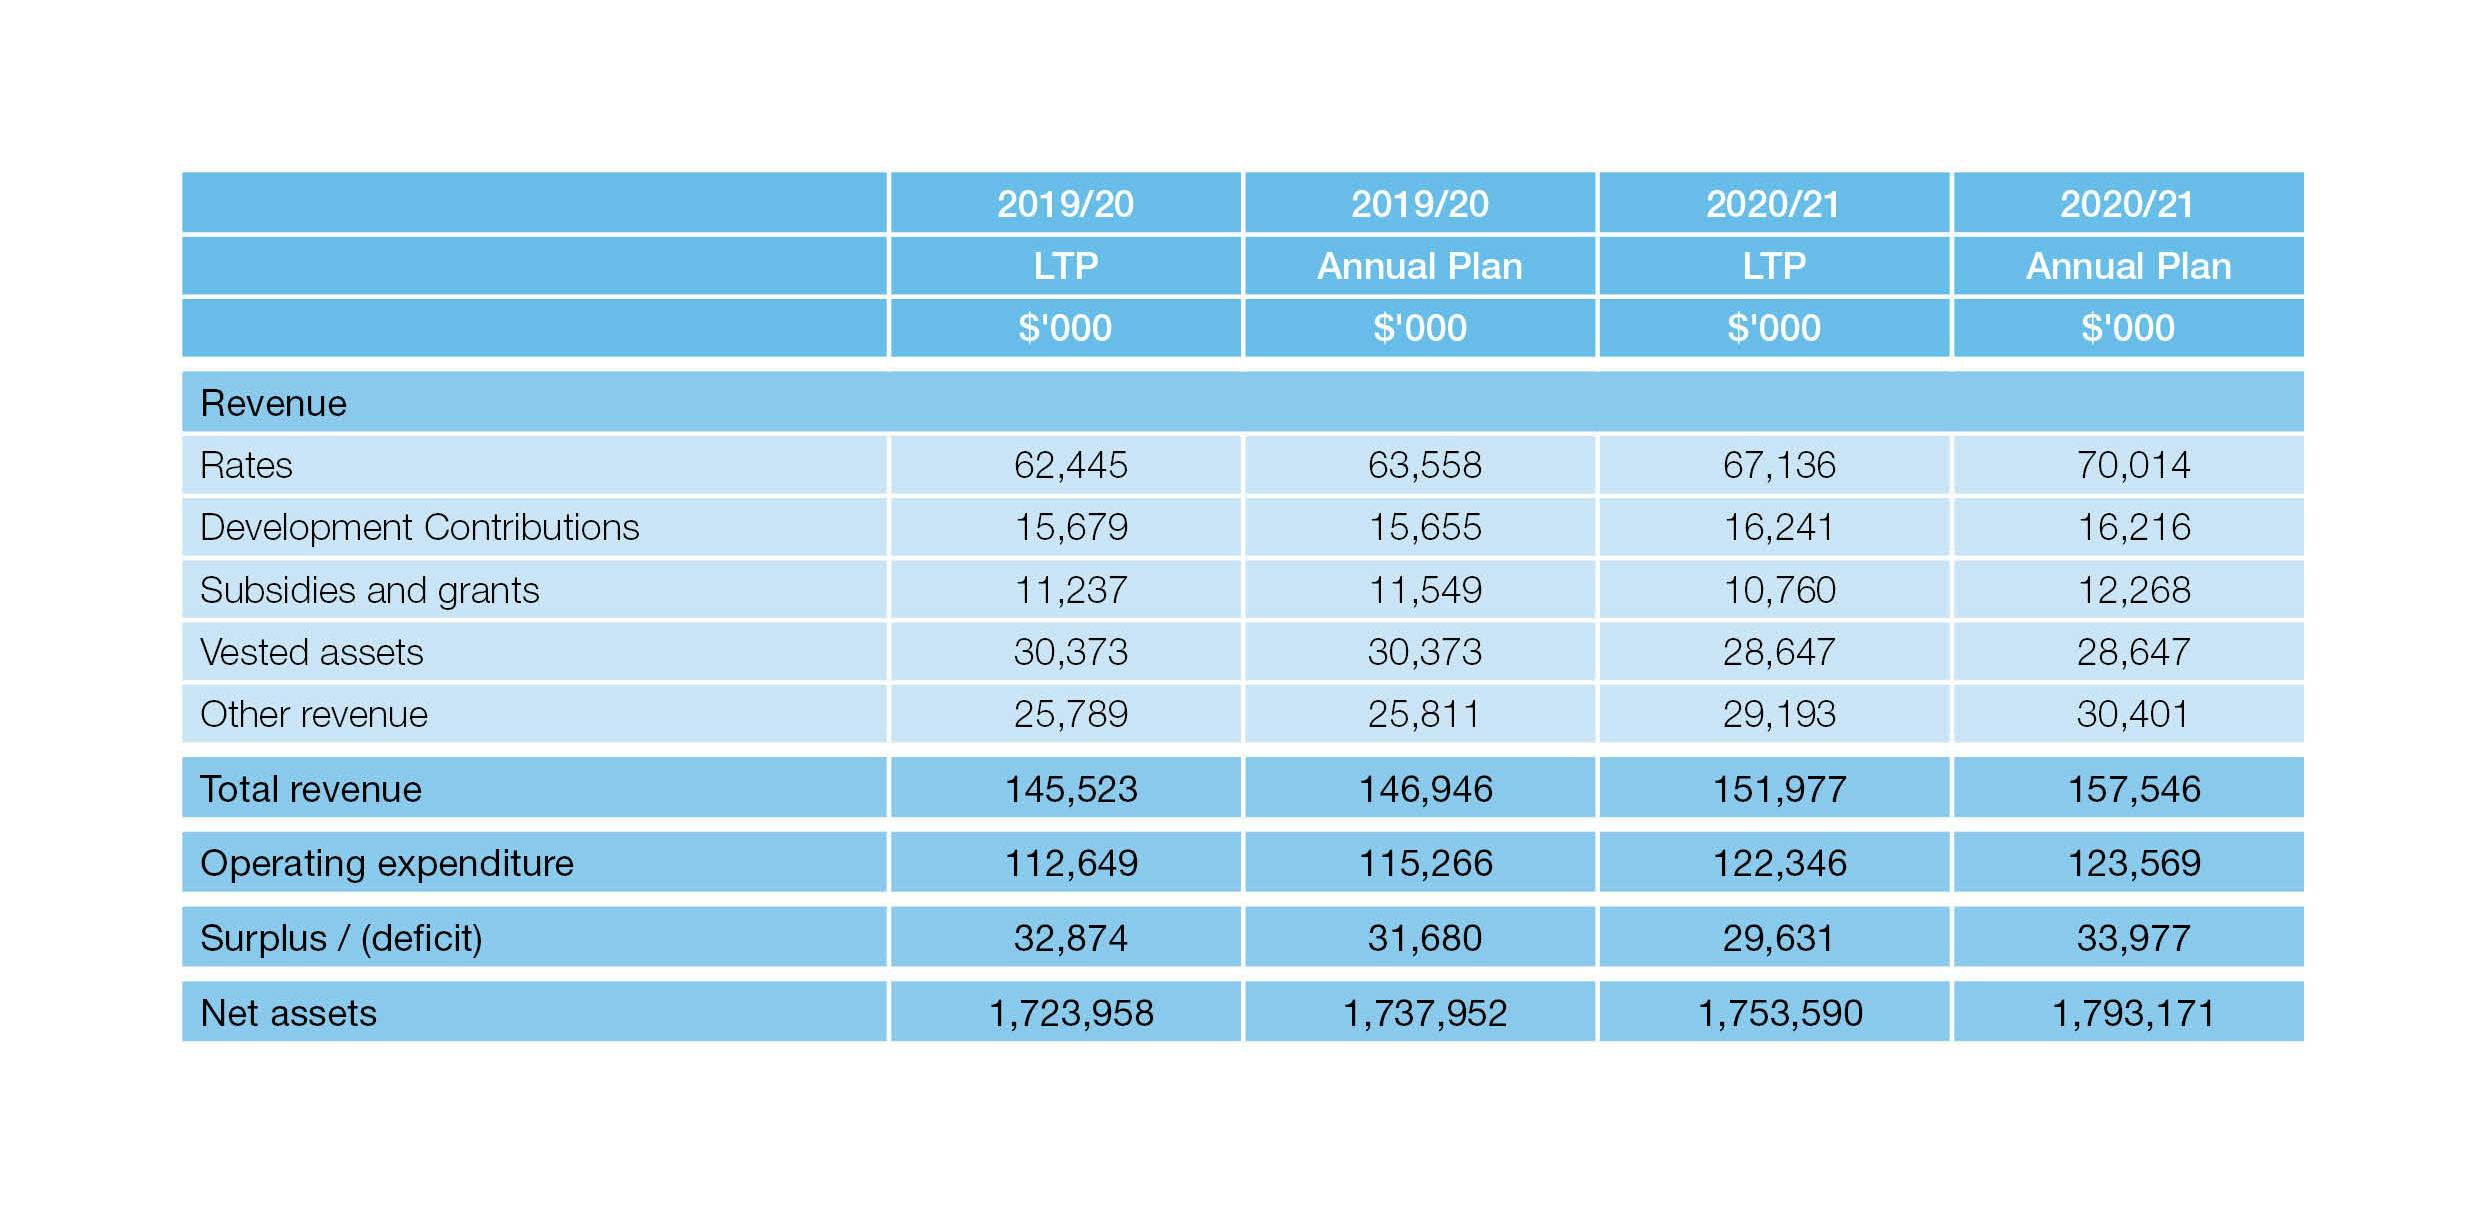
Examples of rating changes for the 2020/21 year in selected locations, showing the proposed rates compared with the current year.
We use cookies to ensure our site functions properly and to store limited information about your usage. You may give or withdraw consent at any time. To find out more, read our privacy policy and cookie policy.